IRC-Statistics / Kajetan Hinner IRC-Statistik
Statistics: Freenode
All graphs have a five minutes resolution except the last one (daily maximum
resolution). Data is collected using a self-written perl-program, which
runs day and night, asking the IRC-server every five minutes for new information. You
can find those scripts at my IRC page
and my Programs page.
There is an automatic update at least once a day.
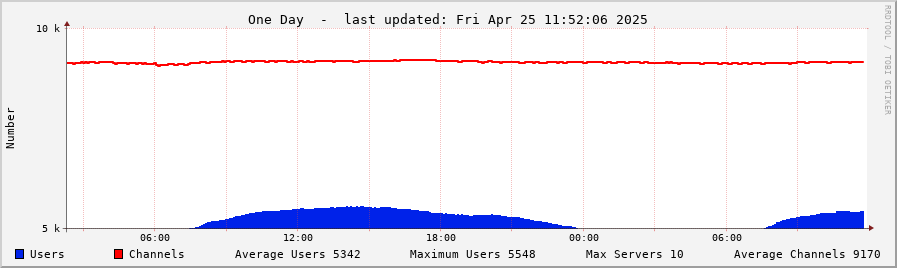
Daily graph.
This graph ends with the most recent data and goes back 24 hours. Counts
of Users and Channels.
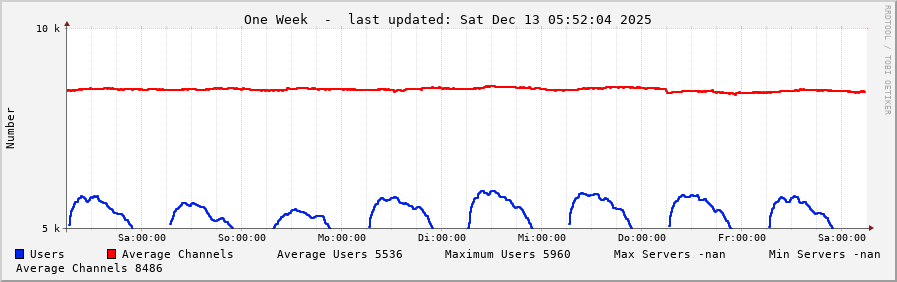
Weekly graph.
Starts eight days before now. Average Users and channels are graphed.
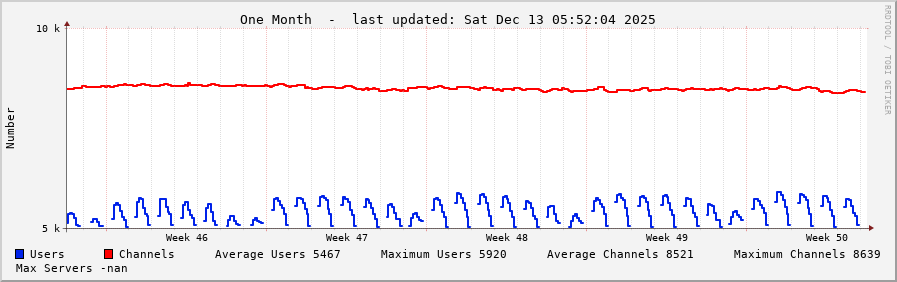
Monthly graph
You guess it. This picture shows us all IRC users and channels starting
five weeks ago.
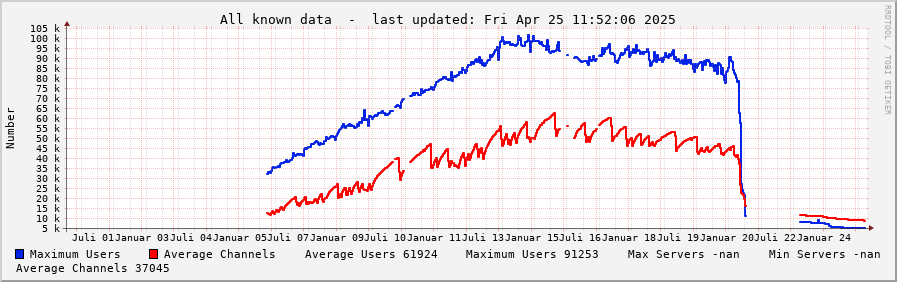
Yearly graph
When there's more data available I will expand this graph's timespan.
Right now we can't. There's not known more...
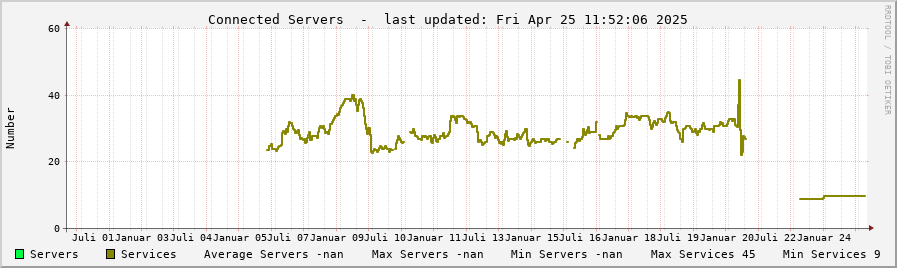
IRC server graph
Here you can see how many IRC servers were connected throughout this IRC Network.
Please stand by for upcoming news. If you think you can contribute,
please write.
Useful Links
My IRC research page
Last changes in page design: December 1st, 2012
This design is (c) 1998-2012 by Dr. Kajetan Hinner. You have to email
and ask for my acceptance, if you want to use any information provided
here commercially. If you quote or print any of my graphs, don't
forget to give proper credit. You are obliged to also cite the link of
this page if you use information provided here.
Follow this Link to get to my homepage.